Blogerroom
73% Wildlife Decline: What WWF's Report Does Not Say
WWF's 2026 Living Planet Report finds monitored wildlife populations fell 73% on average since 1970, but about half are declining and 43% are rising.
By now the headline is familiar: wildlife is down 73%. The 2026 Living Planet Report, released on Oct. 8 by WWF and the Zoological Society of London, repeats that figure for the second edition in a row. It has also produced, once again, a wave of headlines saying the world has lost 73% of its animals. It has not, and the difference between the true meaning and the common misreading matters for what we do next.
What the Report Found
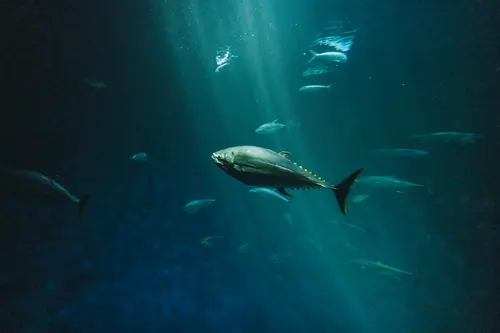
The Living Planet Index tracks 35,803 populations of 5,790 vertebrate species, covering mammals, birds, reptiles, amphibians and fish. Between 1970 and 2022, the average decline across those populations was 73%, WWF and ZSL report, which works out to around 2.5% a year, according to Reuters coverage carried by The Japan Times.
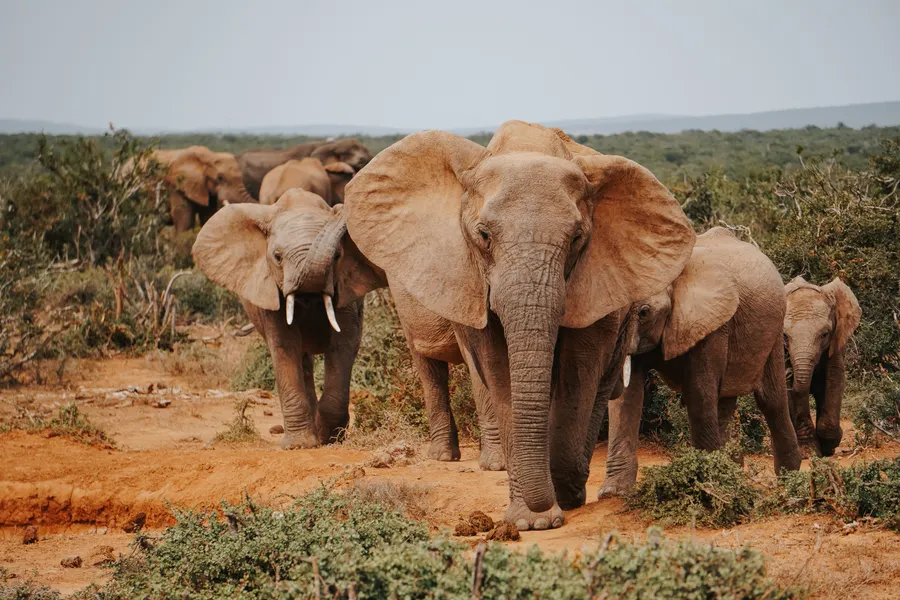
The regional picture is starker. Monitored freshwater species fell by an average of 85%, and terrestrial species by 69%. The steepest declines were in South America, at 95%, followed by Africa at 80%. ZSL's chief conservation officer Andrew Terry told reporters the monitored populations continue to decline on average with no evidence yet of a global recovery.
What 73% Does Not Mean
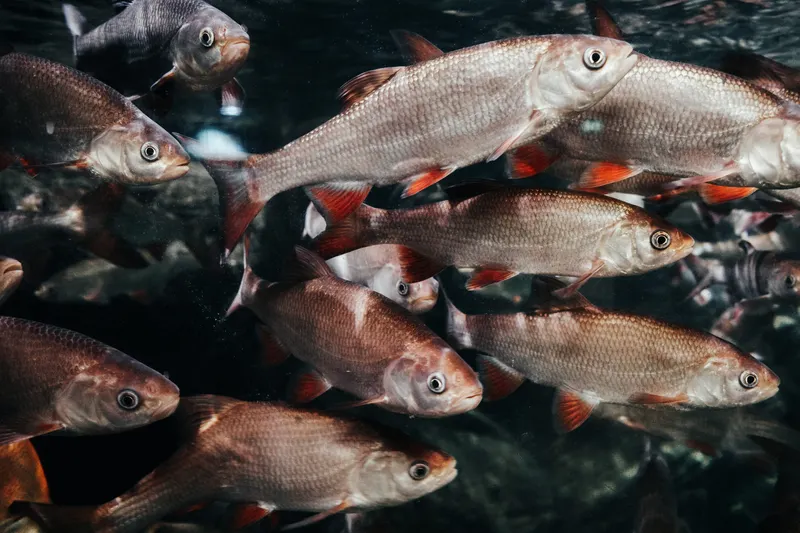
Hannah Ritchie of Our World in Data, in a guide published the same day, lists what the figure does not measure: the number of species lost, the number of individual animals or populations lost, the share of species or populations in decline, or the number of extinctions. Claims that 73% of wildlife has vanished, that 73% of species have gone extinct, or that 73% of species are declining are all incorrect, she writes.
It is an average of changes. If one population falls by 90% and another by 50%, both enter the calculation as rates of change, which are combined using a geometric mean, and some populations are given extra weight. The authors themselves stress this caveat in their materials.
Half Down, Almost Half Up
The detail under the headline is surprising. According to the ZSL technical report cited by Our World in Data, exactly 50% of studied populations declined, 43% increased and 7% were stable. So the average decline is not driven by a majority of populations falling. It is driven by how far the worst-hit ones have fallen.
That is not a reason for comfort. A population that falls by 95% counts for more than one that rises by 20%, and the percentages are sensitive to changes in already small populations, as Reuters noted. In my view, the useful reading of the split is practical: if half the populations are doing fine or improving, understanding why is the cheapest source of conservation lessons.
Why the Number Did Not Move
The 2022 report said 69%. The 2024 report said 73%. The 2026 report also says 73%. Ritchie warns against reading that as a four-point drop followed by a plateau. Almost none of the change has happened in the last few years. Instead, the whole trend line has shifted as the database added data, with about 1,000 more populations (up 3%) and about 300 more species (up 5%) than in 2024.
One change was deliberate. The 2026 edition added many African records, with populations from Africa up 14% and species up 38%, to fix a long-standing gap in coverage. The index also now includes only native species, a change made after the 2022 report. The lesson is that each edition is a new estimate, not an extension of the last.
The Counting Problem
A Conversation analysis published by Phys.org on Oct. 11 adds a caution that fits the report's own caveats: the wildlife we count is not a random sample. Some places, species and periods are monitored far more than others. The index also omits invertebrates and plants, according to Our World in Data.
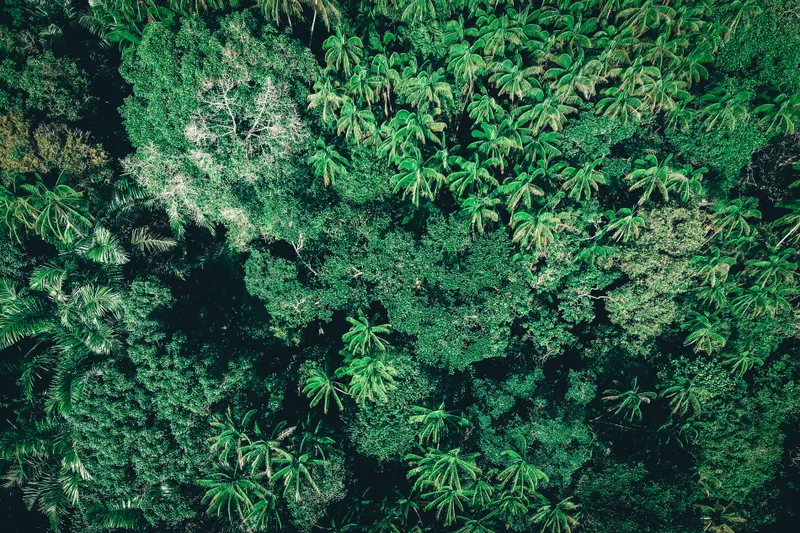
There are winners from habitat change, such as farmland birds that thrive after forest is turned to agriculture, but the analysis says many instances of habitat loss produce far more declines than increases, like converting tropical forest to plantations or grassland to towns. That is an argument for more monitoring, especially in tropical regions where data is thinnest.
What to Take From It
Two readings are both true. The decline in monitored vertebrate populations is real and large, and the index has shown no global turnaround. And the figure has become a slogan, which risks hiding more useful findings about where and why populations fall.
For conservation the link to diversity is direct. A global synthesis Blogerroom covered found that most ecosystem services keep rising with each added species, so losing populations has costs beyond the animals themselves. On the response side, the case Blogerroom covered for protecting standing Amazon forest over replanting points toward where effort pays most in a region the report puts at a 95% average decline.
The report calls itself "The Science of Hope." Hope here is practical: half the populations are not falling, the biggest losses cluster in places and ecosystems that can be named, and better data is already narrowing the gaps.
Written by
Mr. Jitendra Bhatt
Msc in Chemistry and field researcher.